What is Sciris?
Sciris is a library of tools that make writing scientific Python code easier and more pleasant. Extending NumPy and Matplotlib, it covers a wide range of common math, file I/O, and plotting operations, so you can do more with less code. It's a "library of the gaps": the annoyances it addresses are too small to need dedicated libraries of their own, but common enough that together they add up. Philosophically, Sciris is like tidyverse for Python.
Why Sciris?
Brevity

Sciris turns common patterns requiring multiple lines of code into simple functions: sc.parallelize() to run a function across CPUs, sc.save() and sc.load() for arbitrary Python objects, sc.surf3d() for a 3D plot. Less code to write means less code to debug (and fewer tokens).
Plain names

Functions are simply named and easy to type: sc.smooth(), sc.findnearest(), sc.safedivide(), sc.boxoff(). Sciris repackages clunky parts of the standard library, so you can type sc.require() instead of puzzling over packaging.requirements.
Forgiving defaults

Sciris lets you choose how strict to be: many functions take a die argument, with die=True raising an exception and die=False valiantly forging ahead. Either way, you write fewer try/except blocks (but there's sc.tryexcept() to turn four lines into two – or even one).
Installation
Sciris requires Python 3.10 or later, and is based on the usual scientific Python stack.
pip install sciris  # using pip
uv add sciris       # using uv
conda install -c conda-forge sciris  # using conda
Then:
import sciris as sc
Examples
sc.odict is a flexible container representing an associative array, with the best-of-all-worlds features of lists, dictionaries, and numeric arrays. It is based on OrderedDict, but supports integer indexing, key slicing, and item insertion. sc.objdict is the same, but also allows attribute-style access:
data = sc.objdict(a=[1,2,3], b=[4,5,6])

assert data.a == data['a'] == data[0]  # Refer to items by attribute, key, or index
assert data[:].sum() == 21             # You can sum a dict

for i, key, value in data.enumitems():
    print(f'Item {i} is named "{key}" and has value {value}')

# Item 0 is named "a" and has value [1, 2, 3]
# Item 1 is named "b" and has value [4, 5, 6]
To take a based-on-a-true-story example: if results is a dictionary of model runs, and each run is a dictionary with a data key, then getting the data from the first run is results[list(results.keys())[0]]['data'] with plain dictionaries, and results[0].data with an objdict.
Indexing arrays is a common task in NumPy, but it can be awkward when types do not quite match: floats versus integers, lists versus arrays. sc.findinds() finds matches anyway, and accepts multiple conditions:
sc.findinds([2,3,6,3], 3.0)  # Returns array([1, 3])

v = np.random.rand(100)
sc.findinds(v>0.4, v<0.6)    # Indices where both conditions hold
The first line is equivalent to np.nonzero(np.isclose(arr, val))[0], and the second to ((v>0.4)*(v<0.6)).nonzero()[0]. Related functions include sc.findnearest() (nearest value, whether or not it matches exactly), sc.findfirst(), and sc.findlast().
sc.save() and sc.load() handle arbitrary Python objects, including your own classes, so you can stop an analysis and pick it up later:
sc.save('results.obj', results)   # Save any Python object
results = sc.load('results.obj')  # Load it back
If you want a specific format, there is a function for that too: sc.savejson(), sc.loadjson(), sc.savetext(), sc.loadyaml(), sc.dataframe.read_csv(). And if you want to know later what produced a file, sc.savearchive() and sc.savefig() store the date, Python environment, and Git commit alongside the data or the figure, which sc.loadarchive() and sc.loadmetadata() read back.
Scientific workflows are often embarrassingly parallel, yet parallelizing them can still be a hurdle. sc.parallelize() is a shortcut to multiprocess.Pool() that accepts arguments in whichever form is most convenient:
def f(x, y):
    return x*y

out1 = sc.parallelize(f, iterarg=[(1,2), (2,3), (3,4)])
out2 = sc.parallelize(f, iterkwargs={'x':[1,2,3], 'y':[2,3,4]})
out3 = sc.parallelize(f, iterkwargs=[{'x':1, 'y':2},
                                     {'x':2, 'y':3},
                                     {'x':3, 'y':4}])
All three return [2, 6, 12]. By default the pool size is set from the number of CPUs available, but you can specify it, or allocate dynamically based on current load with sc.loadbalancer().
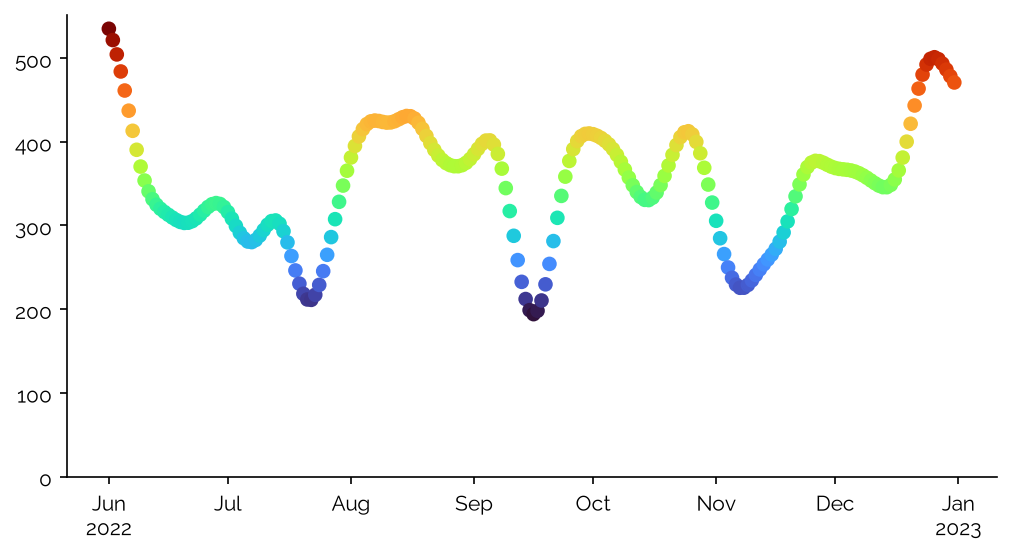
Sciris includes shortcuts for the parts of Matplotlib that are more fiddly than they need to be — date axes, tick formatting, mapping values onto colors:
sc.options(font='Raleway')                       # Set a custom font
x = sc.daterange('2022-06-01', '2022-12-31', as_date=True)  # Create dates
y = sc.smooth(np.random.rand(len(x))**2)*1000    # Create smoothed random numbers
c = sc.vectocolor(y, cmap='turbo')               # Set colors proportional to y

plt.scatter(x, y, c=c)  # Vanilla Matplotlib
sc.dateformatter()      # Automatic date formatting on the x-axis
sc.commaticks()         # Write 1000 as 1,000 rather than 1e3
sc.setylim()            # Set the y-axis to start at zero
sc.boxoff()             # Remove the top and right axis spines
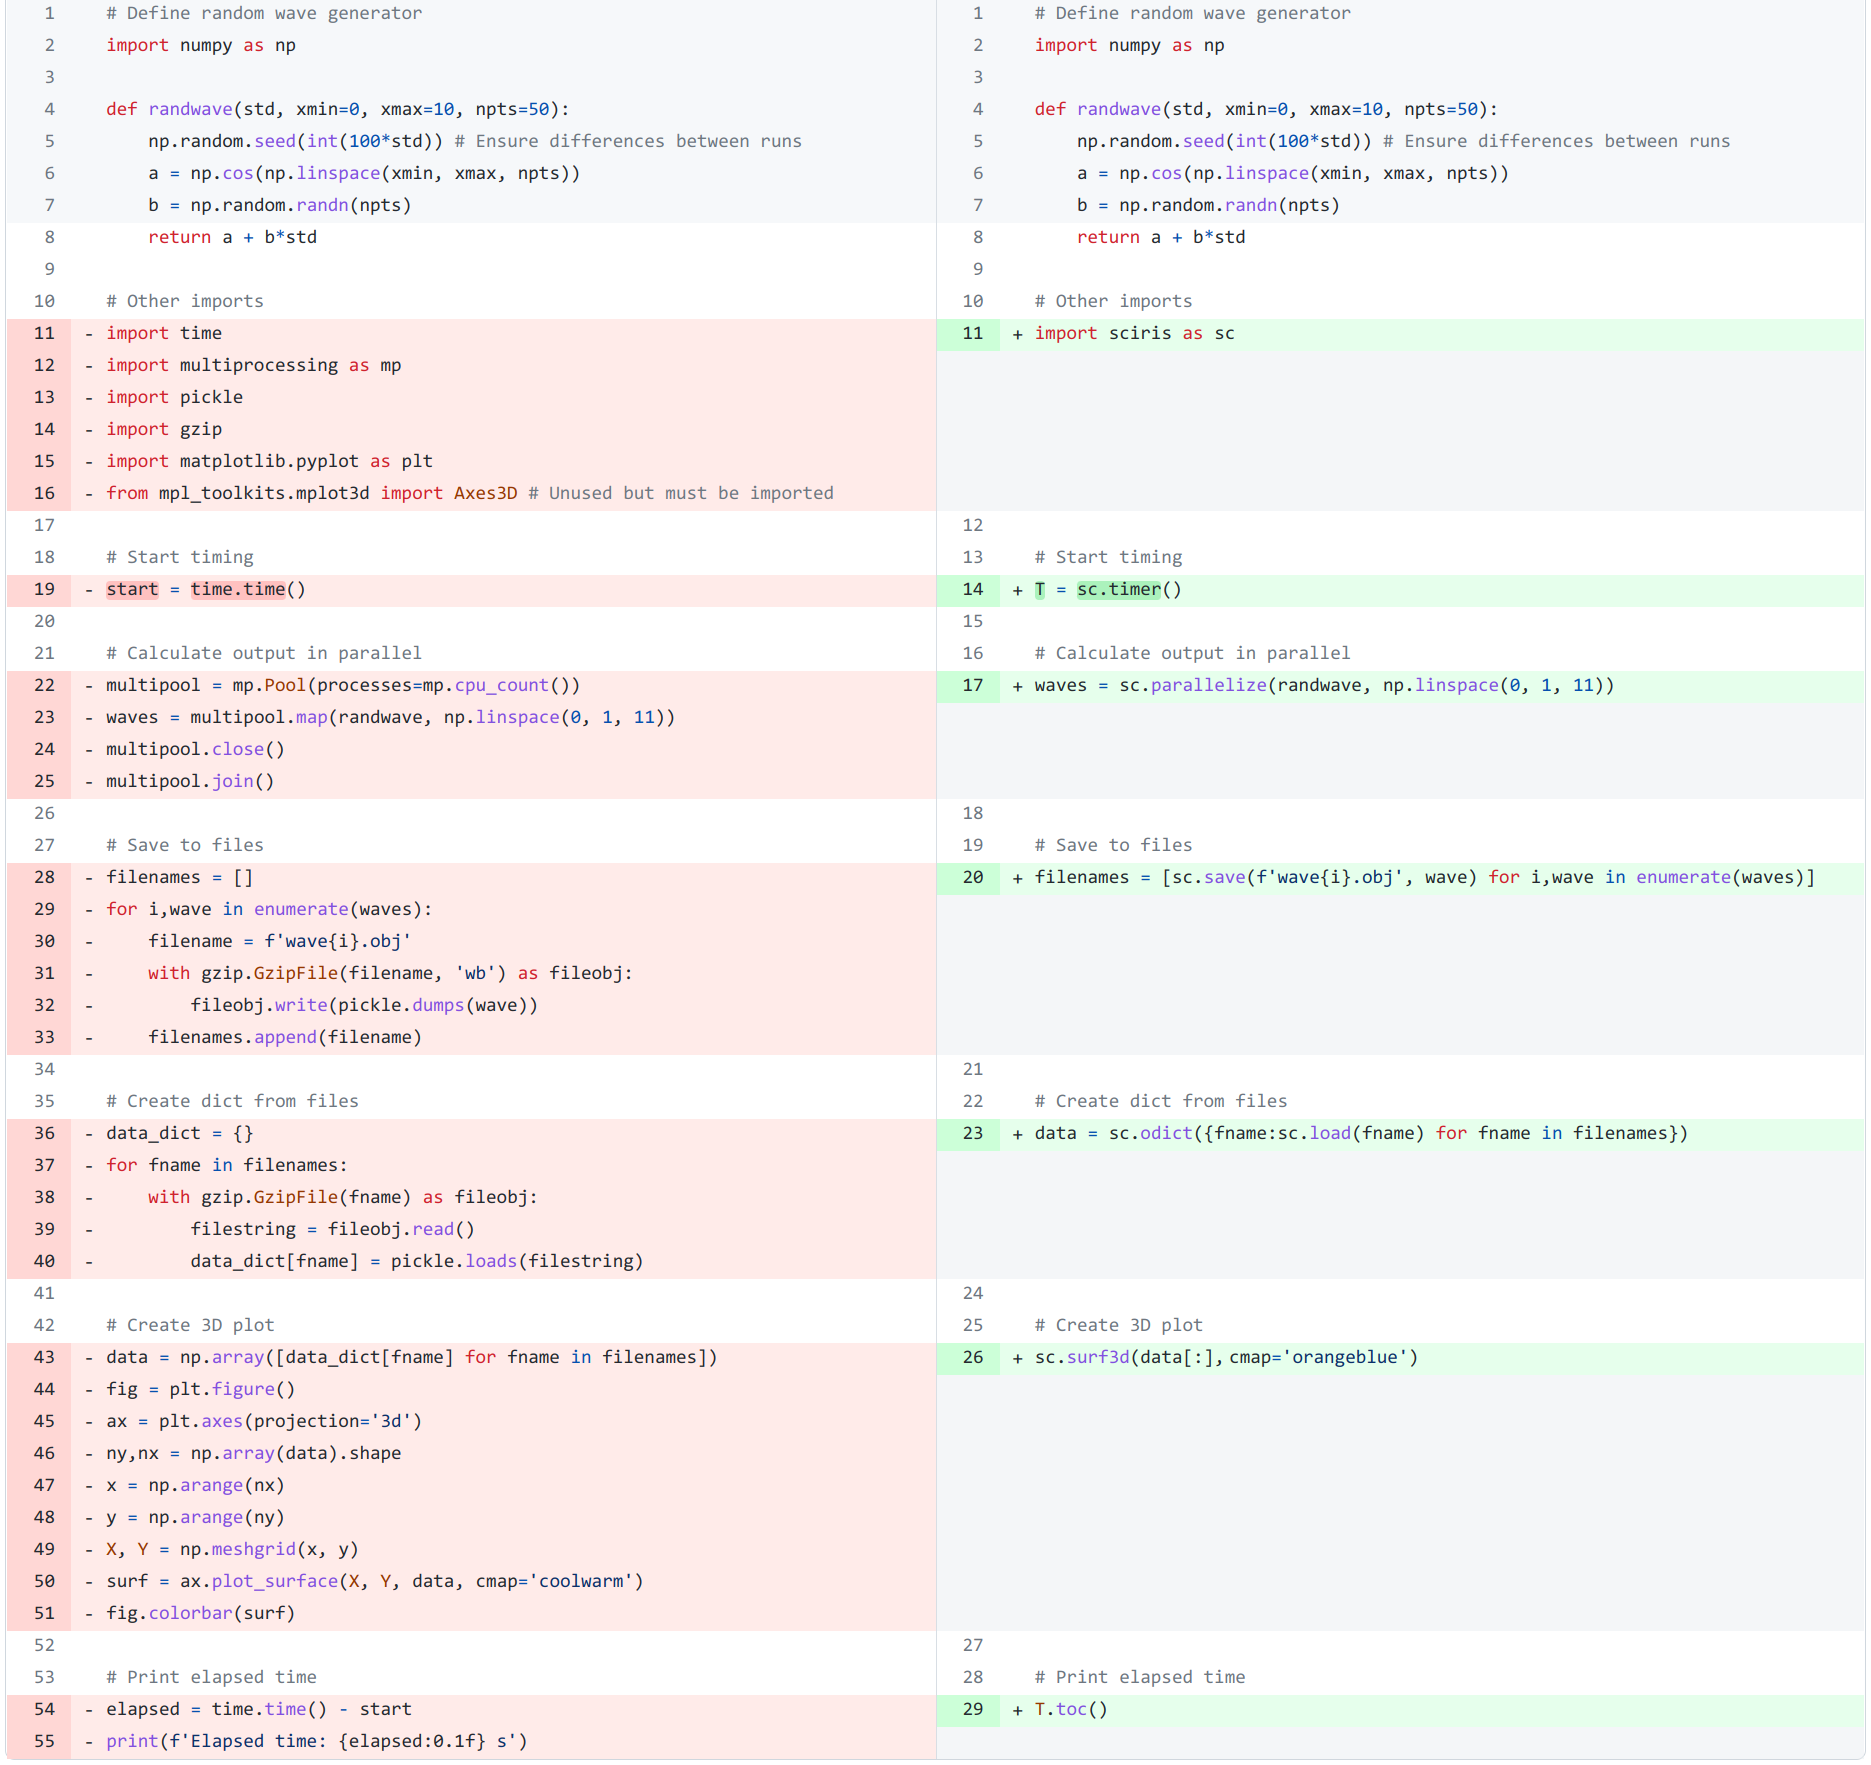
Below are two functionally identical scripts: one written in plain Python (left), one using Sciris (right). Both sample random numbers from a user-defined function at several noise levels, save the intermediate results to disk, load them back, plot them in 3D, and report the elapsed time. The plain Python version takes about twice as many lines in total; counting only the lines that differ, and excluding comments and whitespace, it takes 33 where Sciris takes 7.
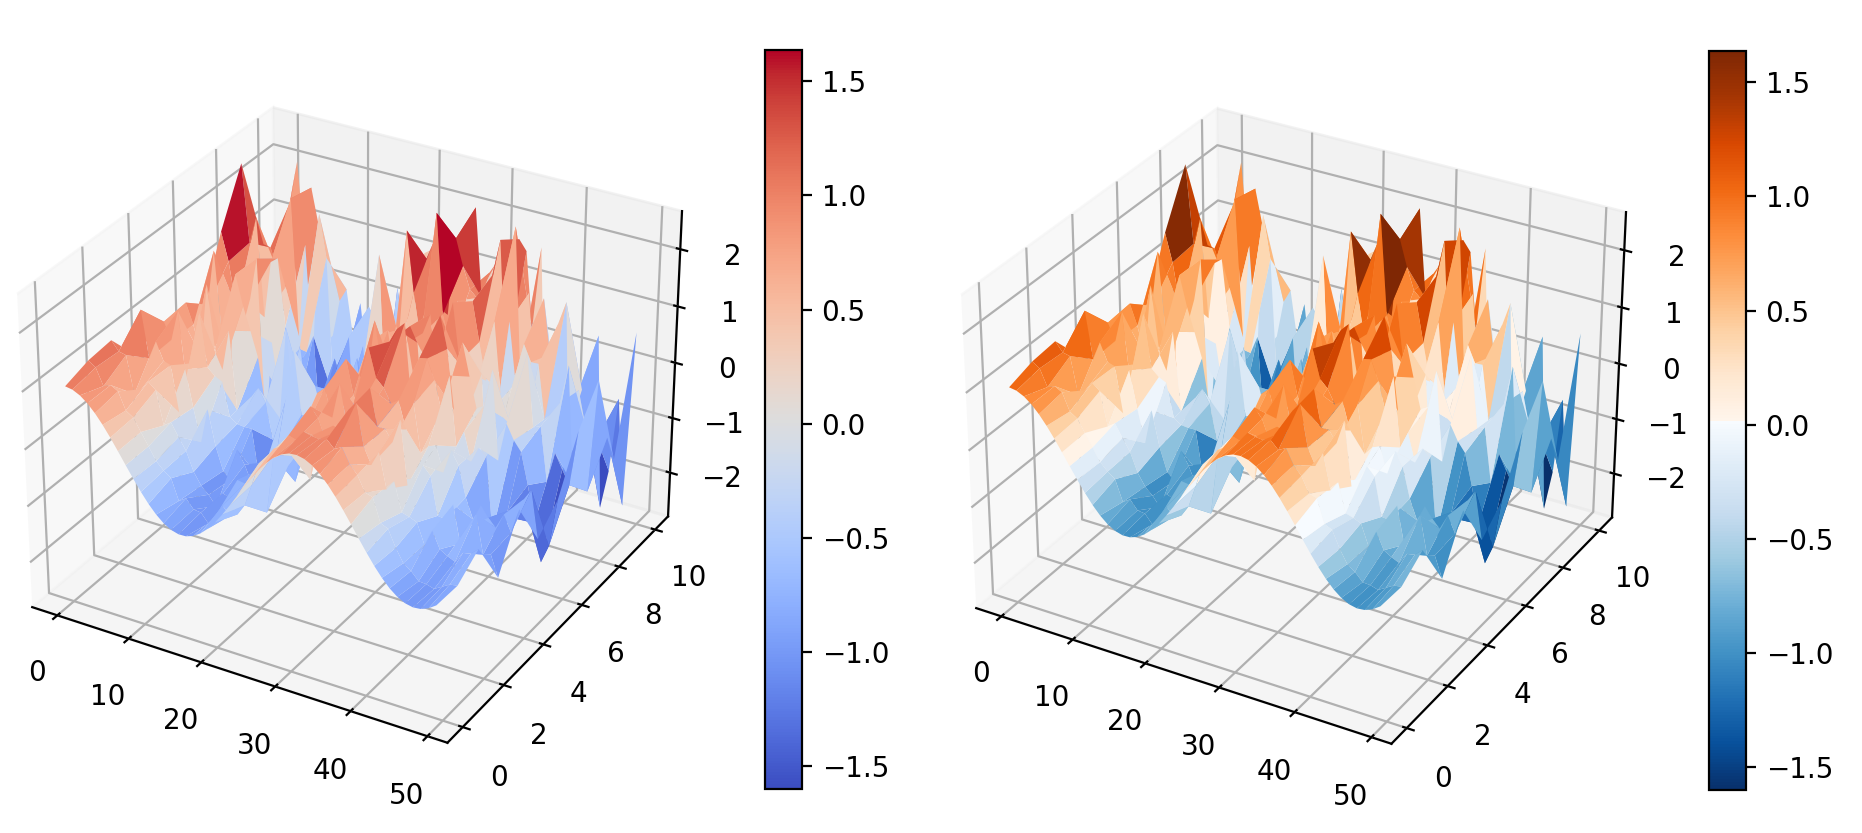
This is the output of the two scripts in the previous tab: plain Python on the left, Sciris on the right. The plots are identical apart from the colormap, which is one of several new ones that Sciris adds.
What's in it
A selection of the most commonly used functions:
Containers
sc.odict(): dictionary that also acts like a list and an arraysc.objdict(): an odict that supportsfoo.baras well asfoo['bar']sc.dataframe(): a pandas DataFrame with extra conveniences
Math and arrays
sc.findinds(),sc.findnearest(),sc.findfirst(),sc.findlast(): locate values in an arraysc.smooth(): smooth 1D or 2D arrayssc.tolist(),sc.toarray(): turn any object into a list or arraysc.asd(): adaptive stochastic descent, for optimizing noisy functions
Files and versioning
sc.save(),sc.load(): save and load any Python objectsc.savejson(),sc.loadjson(),sc.loadyaml(): likewise, for structured textsc.thisdir(),sc.getfilelist(): find your way around the filesystemsc.savearchive(),sc.compareversions(),sc.require(): keep track of what ran where
Printing
sc.pr(): print everything an object contains, including attributes and methodssc.heading(),sc.printbold(),sc.colorize(): readable terminal outputsc.sigfig(): round a number to a given number of significant figuressc.progressbar(): show progress through a loop
Plotting
sc.vectocolor(),sc.gridcolors(): map continuous or categorical data onto colorssc.dateformatter(),sc.commaticks(),sc.SIticks(): readable axis labelssc.plot3d(),sc.surf3d(): 3D plots that work the first timesc.savefig(),sc.savemovie(): save figures with metadata, or as a movie
Parallelization and profiling
sc.parallelize(): run a function many times across many CPUssc.loadbalancer(): allocate CPUs based on current loadsc.timer(),sc.tic(),sc.toc(): time how long things takesc.profile(): line-by-line profiling, without the setup
Other utilities
sc.date(),sc.daterange(),sc.readdate(): dates, from most formats you might havesc.dcp(): deep-copy an object (andsc.robust_dcp()for when that fails)sc.search(),sc.equal(): find things in, or compare, deeply nested objectssc.help(): full-text search of the Sciris source code
Citing Sciris
Sciris is described in the following paper, published in the Journal of Open Source Software:
Kerr CC, Sanz-Leon P, Abeysuriya RG, Chadderdon GL, Harbuz VS, Saidi P, Quiroga MM, Martin-Hughes R, Kelly SL, Cohen JA, Stuart RM, Nachesa A. Sciris: Simplifying scientific software in Python. Journal of Open Source Software 2023; 8(88):5076. DOI: 10.21105/joss.05076.
The citation is also available in BibTeX format.